Apple currently ranks as one of the most valuable companies with a market cap of $3.31 trillion.
Founded in 1976, the company had a long history of innovations from introducing the iPhone in 2007 to releasing the mixed-reality headset Apple Vision Pro in 2024.
Today, there are over 2.2 billion active Apple devices worldwide.
Apple dominates various categories worldwide and in the US, from smartphones to tablets, and has a massive services business. Apple’s App Store alone attracts more than 650 million weekly active users worldwide.
Continue reading to find the latest Apple statistics in 2024.
Here’s a quick summary of what you’ll find on this page:
Key Apple Stats
Apple Annual Revenue
Apple Quarterly Revenue
Apple Revenue by Category
Apple Revenue by Region
Apple iPhone Market Share
Apple iPad Market Share
Apple Mac Market Share
Number of Active Apple Devices Worldwide
Apple Ad Revenue
Apple Music Subscribers
Number of Available Apps in the Apple App Store
Number of Available Games in the Apple App Store
How Many People Work at Apple?
Key Apple Stats
Apple registered an annual revenue of $383.29 billion in 2023.
There are around 2.2 billion active Apple devices worldwide.
iPhone is the largest category by sales, accounting for 50.46% of Apple’s total quarterly revenue in Q2 2024.
161,000 employees work at Apple.
3.84 million apps are available in the Apple App Store
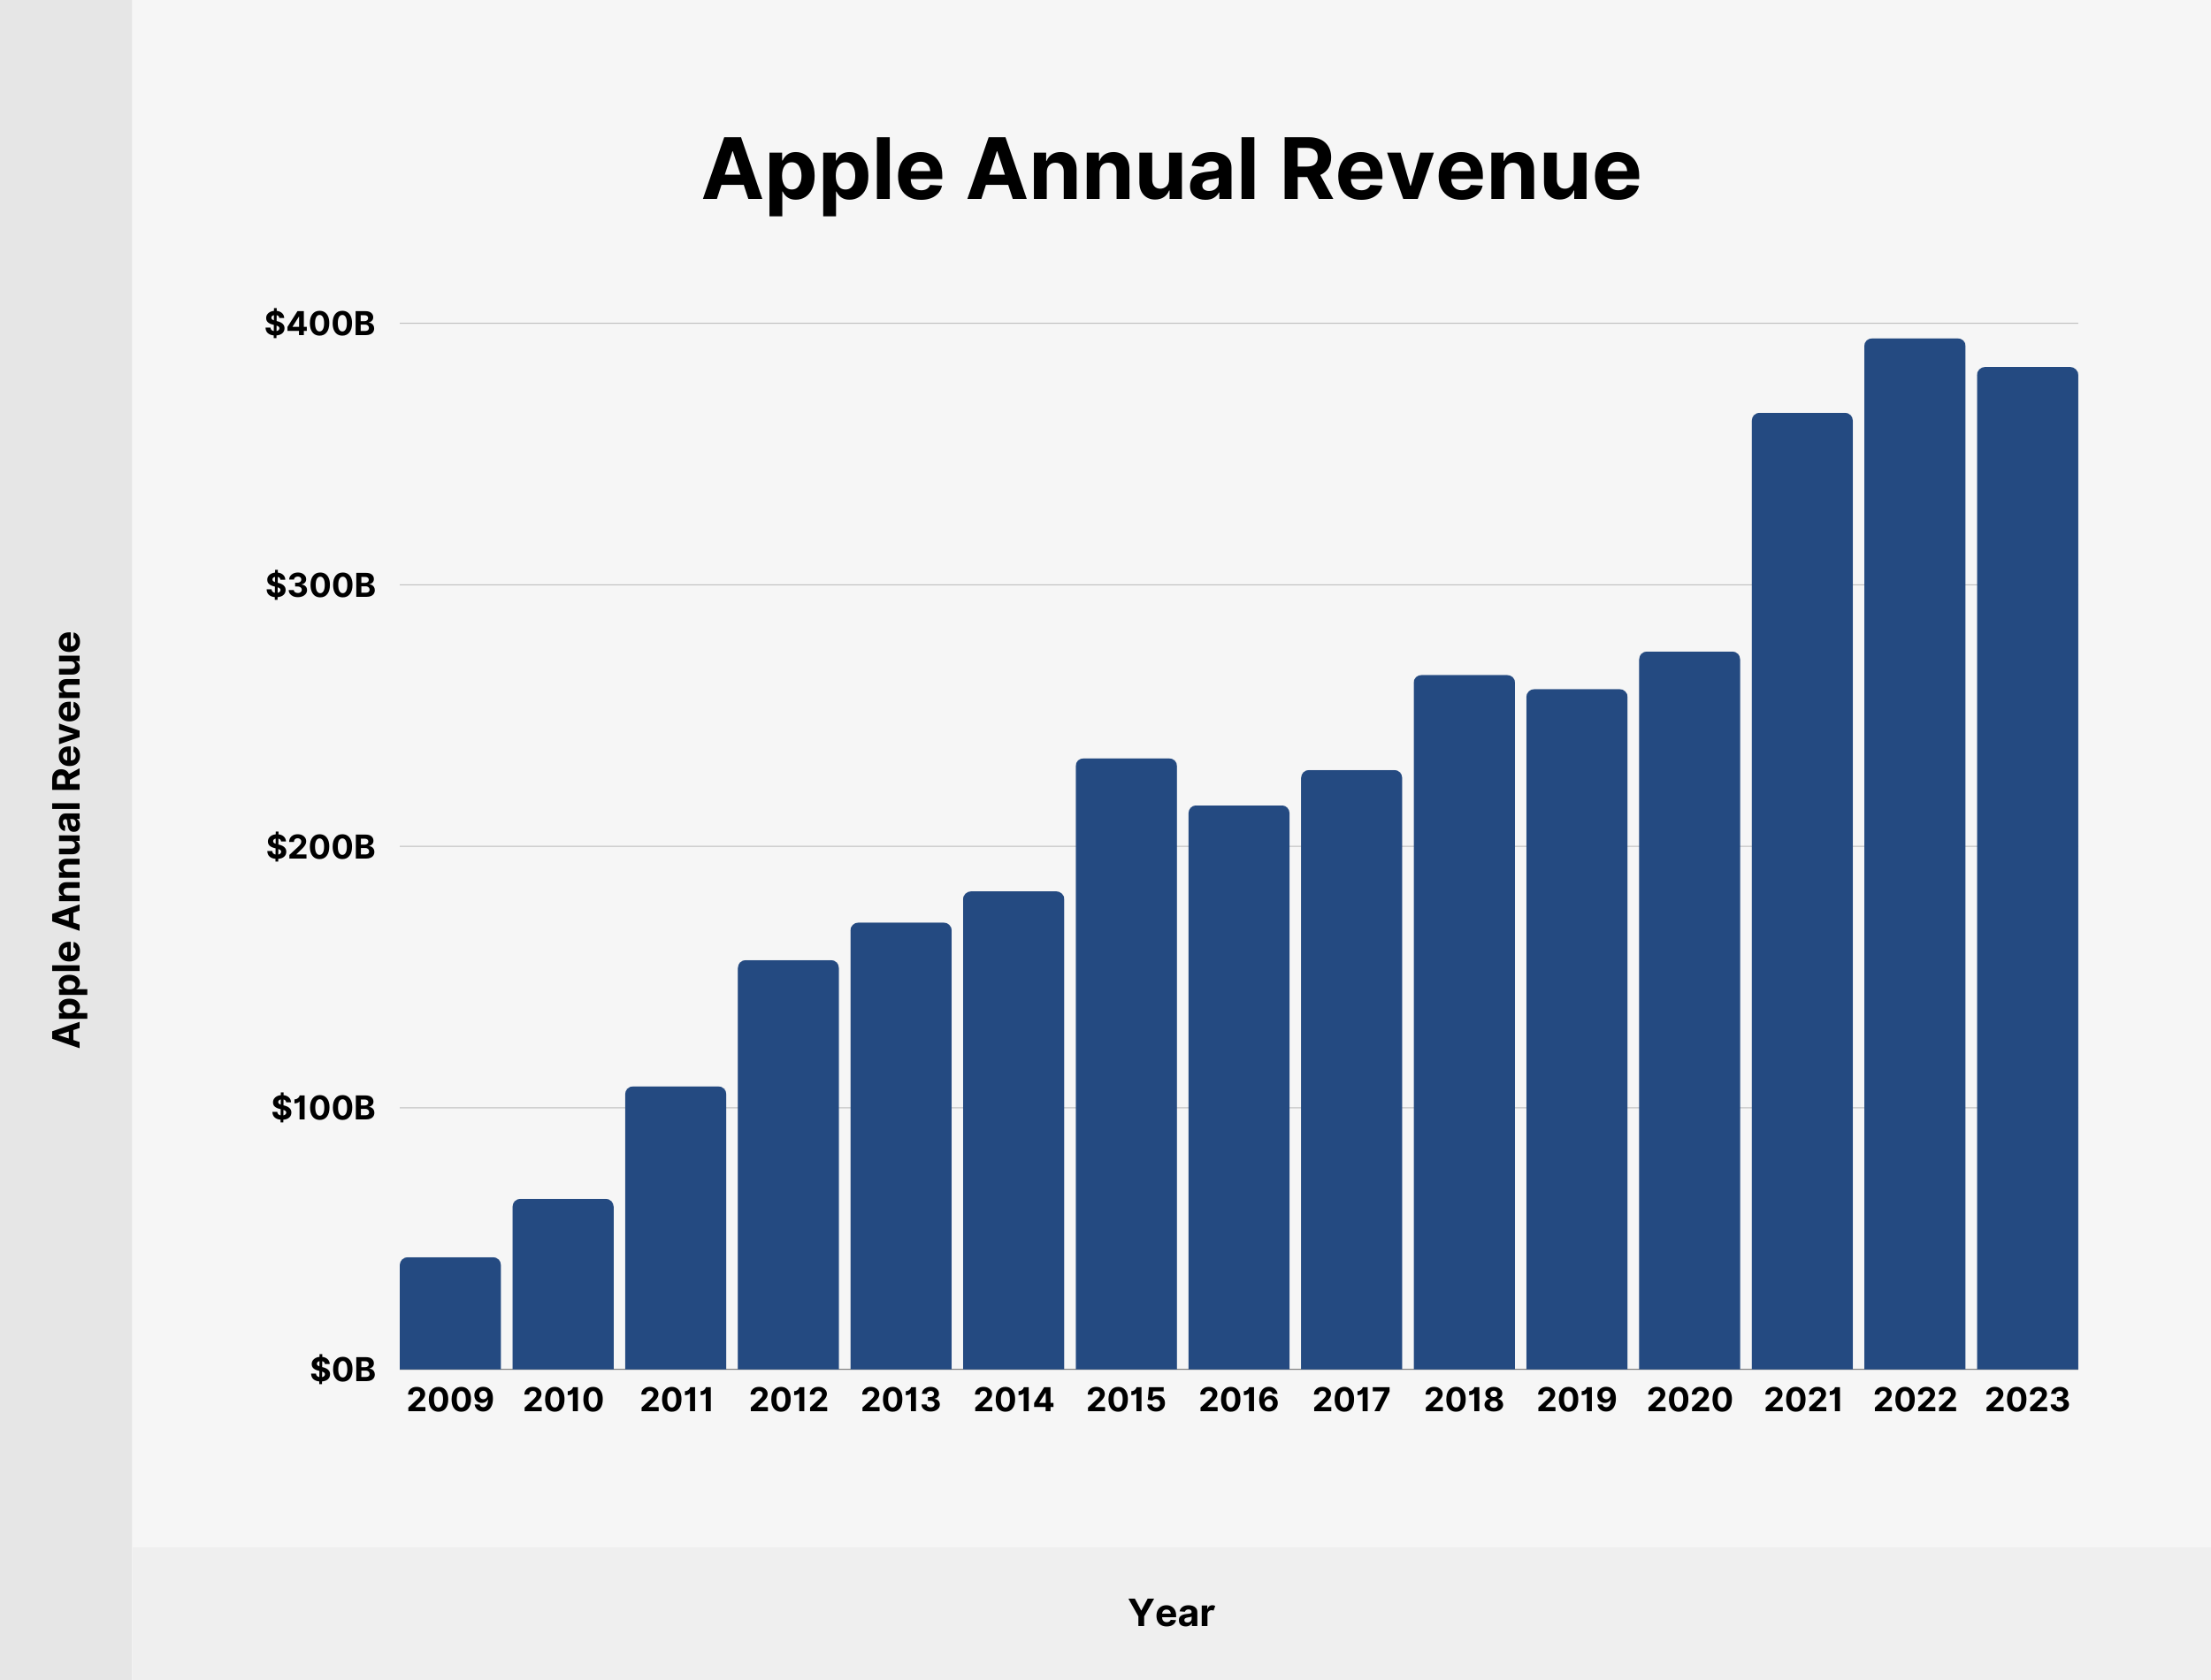
Apple Annual Revenue
Apple brought in an annual revenue of $383.29 billion in 2023. Revenue has decreased by 2.8% over the previous fiscal year.
Here’s a table with Apple’s annual revenue since 2009:
Note: Apple’s fiscal year ends on the last Saturday of September.
Year
Apple Annual Revenue
2009
$42.91 billion
2010
$65.23 billion
2011
$108.25 billion
2012
$156.51 billion
2013
$170.91 billion
2014
$182.8 billion
2015
$233.72 billion
2016
$215.64 billion
2017
$229.23 billion
2018
$265.6 billion
2019
$260.17 billion
2020
$274.52 billion
2021
$365.82 billion
2022
$394.33 billion
2023
$383.29 billion
Source: Apple
Apple Quarterly Revenue
Apple generated a quarterly revenue of $90.75 billion in Q2 2024, representing a 4.31% year-over-year decrease.
We’ve charted Apple’s quarterly revenue since Q1 2019:
Date
Apple Quarterly Revenue
Q1 2019
$84.31 billion
Q2 2019
$58.02 billion
Q3 2019
$53.81 billion
Q4 2019
$64.04 billion
Q1 2020
$91.82 billion
Q2 2020
$58.31 billion
Q3 2020
$59.69 billion
Q4 2020
$64.7 billion
Q1 2021
$111.44 billion
Q2 2021
$89.58 billion
Q3 2021
$81.43 billion
Q4 2021
$83.36 billion
Q1 2022
$123.95 billion
Q2 2022
$97.28 billion
Q3 2022
$82.96 billion
Q4 2022
$90.15 billion
Q1 2023
$117.15 billion
Q2 2023
$94.84 billion
Q3 2023
$81.8 billion
Q4 2023
$89.5 billion
Q1 2024
$119.58 billion
Q2 2024
$90.75 billion
Source: Apple
Apple Revenue by Category
iPhone sales accounted for over half (50.46%) of Apple’s quarterly revenue in Q2 2024, amounting to $45.96 billion.
The iPhone category remains the largest category by sales to Apple to date.
Here’s a detailed breakdown of iPhone sales since Q1 2018, including a share of total Apple revenue:
Date
iPhone Sales
Share of Total Apple Revenue
Q1 2018
$61.58 billion
69.74%
Q2 2018
$37.56 billion
62.21%
Q3 2018
$29.47 billion
56.15%
Q4 2018
$37.19 billion
59.12%
Q1 2019
$51.98 billion
61.66%
Q2 2019
$31.05 billion
53.52%
Q3 2019
$25.99 billion
48.29%
Q4 2019
$33.36 billion
52.1%
Q1 2020
$55.96 billion
60.9%
Q2 2020
$28.96 billion
49.7%
Q3 2020
$26.42 billion
44.26%
Q4 2020
$26.44 billion
40.9%
Q1 2021
$65.6 billion
58.86%
Q2 2021
$47.94 billion
53.51%
Q3 2021
$39.57 billion
48.59%
Q4 2021
$38.87 billion
46.63%
Q1 2022
$71.63 billion
57.8%
Q2 2022
$50.57 billion
51.99%
Q3 2022
$40.67 billion
49.02%
Q4 2022
$42.63 billion
47.29%
Q1 2023
$65.78 billion
56.14%
Q2 2023
$51.33 billion
54.13%
Q3 2023
$39.67 billion
48.5%
Q4 2023
$43.81 billion
48.95%
Q1 2024
$69.7 billion
58.29%
Q2 2024
$45.96 billion
50.64%
Apple’s service business (includes revenue from the App Store, iTunes Store, fees related to AppleCare, Apple Pay, and other services) is the second largest category.
In Q2 2024, Apple services revenue amounted to $23.87 billion, accounting for 26.3% of total quarterly revenue. That’s an all-time high revenue from services to date.
We’ve charted Apple’s services revenue since Q1 2018:
Date
Services Revenue
Share of Total Apple Revenue
Q1 2018
$8.47 billion
9.59%
Q2 2018
$9.85 billion
15.03%
Q3 2018
$10.17 billion
17.93%
Q4 2018
$9.98 billion
15.87%
Q1 2019
$10.88 billion
12.9%
Q2 2019
$11.45 billion
19.74%
Q3 2019
$11.46 billion
21.29%
Q4 2019
$12.51 billion
19.54%
Q1 2020
$12.72 billion
13.85%
Q2 2020
$13.35 billion
22.89%
Q3 2020
$13.16 billion
22.04%
Q4 2020
$14.55 billion
22.5%
Q1 2021
$15.76 billion
14.14%
Q2 2021
$16.9 billion
18.87%
Q3 2021
$17.49 billion
21.47%
Q4 2021
$18.28 billion
21.93%
Q1 2022
$19.52 billion
15.76%
Q2 2022
$19.82 billion
20.37%
Q3 2022
$19.6 billion
23.63%
Q4 2022
$19.19 billion
21.28%
Q1 2023
$20.77 billion
17.73%
Q2 2023
$20.91 billion
22.05%
Q3 2023
$21.21 billion
25.93%
Q4 2023
$22.31 billion
24.93%
Q1 2024
$23.12 billion
19.33%
Q2 2024
$23.87 billion
26.3%
Apple wearables, home, and accessories revenue includes sales of Apple Watch, wireless headphones, HomePod, Apple TV, and accessories.
Apple wearables, home, and accessories revenue amounted to $7.91 billion in Q2 2024, accounting for 8.72% of total revenue, that’s more than Mac ($7.45 billion) or iPad ($5.56 billion) sales.
Here’s a detailed breakdown of Apple wearables, home, and accessories revenue since Q1 2018:
Date
Wearables, Home, and Accessories Revenue
Share of Total Apple Revenue
Q1 2018
$5.49 billion
6.22%
Q2 2018
$3.94 billion
6.47%
Q3 2018
$3.73 billion
7.02%
Q4 2018
$4.23 billion
6.7%
Q1 2019
$7.31 billion
8.67%
Q2 2019
$5.13 billion
8.84%
Q3 2019
$5.53 billion
10.27%
Q4 2019
$6.52 billion
10.18%
Q1 2020
$10.01 billion
10.9%
Q2 2020
$6.28 billion
10.78%
Q3 2020
$6.45 billion
10.81%
Q4 2020
$7.88 billion
12.2%
Q1 2021
$12.97 billion
11.64%
Q2 2021
$7.84 billion
8.75%
Q3 2021
$8.78 billion
10.78%
Q4 2021
$8.79 billion
10.54%
Q1 2022
$14.7 billion
11.86%
Q2 2022
$8.81 billion
9.05%
Q3 2022
$8.08 billion
9.74%
Q4 2022
$9.65 billion
10.7%
Q1 2023
$13.48 billion
11.51%
Q2 2023
$8.76 billion
9.23%
Q3 2023
$8.28 billion
10.13%
Q4 2023
$9.32 billion
10.42%
Q1 2024
$11.95 billion
10%
Q2 2024
$7.91 billion
8.72%
Mac sales reached $7.45 billion in Q2 2024, accounting for 8.21% of Apple’s total quarterly revenue.
Here’s a table with Mac revenue since Q1 2018:
Date
Mac Sales
Share of Total Apple Revenue
Q1 2018
$6.9 billion
7.81%
Q2 2018
$5.78 billion
9.57%
Q3 2018
$5.26 billion
10%
Q4 2018
$7.41 billion
11.78%
Q1 2019
$7.42 billion
8.8%
Q2 2019
$5.51 billion
9.5%
Q3 2019
$5.82 billion
10.82%
Q4 2019
$6.99 billion
10.92%
Q1 2020
$7.16 billion
7.8%
Q2 2020
$5.35 billion
9.18%
Q3 2020
$7.08 billion
11.86%
Q4 2020
$9.03 billion
14%
Q1 2021
$8.68 billion
7.78%
Q2 2021
$9.1 billion
10.16%
Q3 2021
$8.24 billion
10.11%
Q4 2021
$9.18 billion
11.01%
Q1 2022
$10.85 billion
8.76%
Q2 2022
$10.44 billion
10.73%
Q3 2022
$7.38 billion
8.9%
Q4 2022
$11.51 billion
12.77%
Q1 2023
$7.74 billion
6.6%
Q2 2023
$7.17 billion
7.56%
Q3 2023
$6.84 billion
8.36%
Q4 2023
$7.61 billion
8.5%
Q1 2024
$7.78 billion
6.51%
Q2 2024
$7.45 billion
8.21%
Apple registered $5.56 billion in iPad sales in Q2 2024, accounting for 6.13% of total quarterly revenue.
Here’s a table showing iPad sales since Q1 2018:
Date
iPad Sales
Share of Total Apple Revenue
Q1 2018
$5.86 billion
6.44%
Q2 2018
$4.01 billion
6.73%
Q3 2018
$4.63 billion
8.9%
Q4 2018
$4.09 billion
6.5%
Q1 2019
$6.73 billion
7.98%
Q2 2019
$4.87 billion
8.4%
Q3 2019
$5.02 billion
9.33%
Q4 2019
$4.66 billion
7.27%
Q1 2020
$5.98 billion
6.51%
Q2 2020
$4.37 billion
7.5%
Q3 2020
$6.58 billion
11.03%
Q4 2020
$6.8 billion
10.05%
Q1 2021
$8.44 billion
7.57%
Q2 2021
$7.81 billion
8.71%
Q3 2021
$7.37 billion
9.05%
Q4 2021
$8.25 billion
9.9%
Q1 2022
$7.25 billion
5.85%
Q2 2022
$7.65 billion
7.86%
Q3 2022
$7.22 billion
8.71%
Q4 2022
$7.17 billion
7.96%
Q1 2023
$9.4 billion
8.02%
Q2 2023
$6.67 billion
7.03%
Q3 2023
$5.79 billion
7.08%
Q4 2023
$6.44 billion
7.2%
Q1 2024
$7.02 billion
5.87%
Q2 2024
$5.56 billion
6.13%
Source: Apple
Apple Revenue by Region
Apple provides a regional breakdown of revenue by region.
Apple sales data is based on the location of customers and sales.
The Americas region accounted for $37.27 billion (41.07%) of total Apple revenue in Q2 2024. Revenue from the Americas market has decreased by 1.35% over the past year.
Here’s a detailed breakdown of Apple quarterly in the Americas region since Q1 2018, including share of total revenue:
Date
Apple Americas Revenue
Share of Total Apple Revenue
Q1 2018
$35.19 billion
39.9%
Q2 2018
$24.84 billion
40.63%
Q3 2018
$24.54 billion
46.08%
Q4 2018
$27.52 billion
43.75%
Q1 2019
$36.94 billion
43.81%
Q2 2019
$25.6 billion
44.12%
Q3 2019
$25.06 billion
46.56%
Q4 2019
$29.32 billion
45.79%
Q1 2020
$41.37 billion
45.05%
Q2 2020
$25.47 billion
43.68%
Q3 2020
$27 billion
45.27%
Q4 2020
$30.7 billion
45.4%
Q1 2021
$46.31 billion
41.56%
Q2 2021
$34.31 billion
38.29%
Q3 2021
$35.87 billion
44.04%
Q4 2021
$36.82 billion
44.17%
Q1 2022
$51.5 billion
41.55%
Q2 2022
$40.88 billion
42.03%
Q3 2022
$37.47 billion
45.17%
Q4 2022
$39.81 billion
44.16%
Q1 2023
$49.28 billion
42.06%
Q2 2023
$37.78 billion
39.84%
Q3 2023
$35.38 billion
43.26%
Q4 2023
$40.12 billion
44.82%
Q1 2024
$50.43 billion
42.17%
Q2 2024
$37.27 billion
41.07%
Europe is the second-largest market for Apple. Apple’s revenue in Europe amounted to $24.12 billion in Q2 2024, 26.58% of total quarterly revenue.
We’ve charted Apple’s quarterly revenue from the European market since Q1 2018:
Date
Apple Europe Revenue
Share of Total Apple Revenue
Q1 2018
$21.05 billion
23.85%
Q2 2018
$13.85 billion
22.65%
Q3 2018
$12.14 billion
22.79%
Q4 2018
$15.38 billion
24.45%
Q1 2019
$20.36 billion
24.15%
Q2 2019
$13.05 billion
22.5%
Q3 2019
$11.93 billion
22.16%
Q4 2019
$14.95 billion
23.34%
Q1 2020
$23.27 billion
25.35%
Q2 2020
$14.29 billion
24.51%
Q3 2020
$14.17 billion
23.75%
Q4 2020
$16.9 billion
25%
Q1 2021
$27.31 billion
24.5%
Q2 2021
$22.26 billion
24.85%
Q3 2021
$18.94 billion
23.26%
Q4 2021
$20.79 billion
24.94%
Q1 2022
$27.75 billion
24%
Q2 2022
$23.28 billion
23.94%
Q3 2022
$19.29 billion
23.25%
Q4 2022
$22.76 billion
25.29%
Q1 2023
$27.68 billion
23.63%
Q2 2023
$23.95 billion
25.25%
Q3 2023
$20.21 billion
24.7%
Q4 2023
$22.46 billion
25.1%
Q1 2024
$30.4 billion
25.42%
Q2 2024
$24.12 billion
26.58%
The Greater China market accounted for $16.37 billion of Apple’s quarterly revenue in Q2 2024, representing 18.04% of total revenue.
Here’s a table with Apple Greater China revenue since Q1 2018:
Date
Apple Greater China Revenue
Share of Total Apple Revenue
Q1 2018
$17.96 billion
20.34%
Q2 2018
$13.02 billion
21.3%
Q3 2018
$9.55 billion
17.93%
Q4 2018
$11.41 billion
18.14%
Q1 2019
$13.17 billion
15.62%
Q2 2019
$10.22 billion
17.61%
Q3 2019
$9.16 billion
17.02%
Q4 2019
$11.13 billion
17.39%
Q1 2020
$13.58 billion
14.79%
Q2 2020
$9.46 billion
16.21%
Q3 2020
$9.33 billion
15.63%
Q4 2020
$7.95 billion
14.7%
Q1 2021
$21.31 billion
19.13%
Q2 2021
$17.73 billion
19.79%
Q3 2021
$14.76 billion
18.13%
Q4 2021
$14.56 billion
17.47%
Q1 2022
$25.78 billion
20.8%
Q2 2022
$18.34 billion
18.86%
Q3 2022
$14.6 billion
17.6%
Q4 2022
$15.47 billion
17.16%
Q1 2023
$23.91 billion
20.41%
Q2 2023
$17.81 billion
18.78%
Q3 2023
$15.76 billion
19.27%
Q4 2023
$15.08 billion
16.85%
Q1 2024
$20.82 billion
17.41%
Q2 2024
$16.37 billion
18.04%
Apple’s revenue in Japan amounted to $6.26 billion in Q2 2024, accounting for 6.9% of total quarterly revenue.
Here’s a table showing Apple Japan’s revenue since Q1 2018:
Date
Apple Japan Revenue
Share of Total Apple Revenue
Q1 2018
$7.24 billion
8.2%
Q2 2018
$5.47 billion
8.94%
Q3 2018
$3.87 billion
7.26%
Q4 2018
$5.16 billion
8.21%
Q1 2019
$6.91 billion
8.2%
Q2 2019
$5.53 billion
9.54%
Q3 2019
$4.08 billion
7.59%
Q4 2019
$4.98 billion
7.78%
Q1 2020
$6.22 billion
6.78%
Q2 2020
$5.21 billion
8.93%
Q3 2020
$4.97 billion
8.32%
Q4 2020
$5.02 billion
7.8%
Q1 2021
$8.29 billion
7.43%
Q2 2021
$7.74 billion
8.64%
Q3 2021
$6.46 billion
7.93%
Q4 2021
$5.99 billion
7.19%
Q1 2022
$7.12 billion
5.73%
Q2 2022
$7.72 billion
7.94%
Q3 2022
$5.45 billion
6.56%
Q4 2022
$5.7 billion
6.32%
Q1 2023
$6.76 billion
5.77%
Q2 2023
$7.18 billion
7.57%
Q3 2023
$4.82 billion
5.89%
Q4 2023
$5.51 billion
6.15%
Q1 2024
$7.77 billion
6.5%
Q2 2024
$6.26 billion
6.9%
Apple’s revenue in the rest of Asia Pacific amounted to $6.72 billion in Q2 2024, accounting for 7.41% of total quarterly revenue.
We’ve charted Apple’s revenue in the Rest of Asia Pacific since Q1 2018:
Date
Apple Rest of Asia Pacific Revenue
Share of Total Apple Revenue
Q1 2018
$6.85 billion
7.76%
Q2 2018
$3.96 billion
6.47%
Q3 2018
$3.17 billion
5.95%
Q4 2018
$3.43 billion
5.45%
Q1 2019
$6.93 billion
8.22%
Q2 2019
$3.62 billion
6.23%
Q3 2019
$3.59 billion
6.67%
Q4 2019
$3.66 billion
5.71%
Q1 2020
$7.38 billion
8.04%
Q2 2020
$3.89 billion
6.66%
Q3 2020
$4.2 billion
7.04%
Q4 2020
$4.13 billion
7.1%
Q1 2021
$8.23 billion
7.38%
Q2 2021
$7.54 billion
8.42%
Q3 2021
$5.4 billion
6.62%
Q4 2021
$5.19 billion
6.23%
Q1 2022
$9.81 billion
7.91%
Q2 2022
$7.04 billion
7.24%
Q3 2022
$6.15 billion
7.41%
Q4 2022
$6.37 billion
7.07%
Q1 2023
$9.54 billion
8.13%
Q2 2023
$8.12 billion
8.56%
Q3 2023
$5.63 billion
6.88%
Q4 2023
$6.33 billion
7.08%
Q1 2024
$10.62 billion
8.5%
Q2 2024
$6.72 billion
7.41%
Source: Apple
Apple iPhone Market Share
Apple claimed a 17% market share of the worldwide smartphone market in Q1 2024.
Here’s a table with Apple iPhone’s worldwide market share since 2007:
Year
Apple iPhone Market Share
2007
3%
2008
9%
2009
14%
2010
15%
2011
18%
2012
18%
2013
15%
2014
15%
2015
12%
2016
11%
2017
11%
2018
10%
2019
11%
2020
12%
2021
14%
2022
16%
2023
16%
Q1 2024
17%
Source: Counterpoint Research
Apple iPad Market Share
In Q1 2024, Apple iPad claimed a 32% market share of the global tablet market.
That’s down from 35.2% market share in Q1 2023.
Here’s a table showing iPad market share since 2022:
Date
iPad Market Share
2022
37.4%
Q1 2023
35.2%
2023
37.8%
Q1 2024
32.0%
Apple Mac Market Share
In Q1 2024, Apple Mac accounted for an 8.1% market share of the worldwide desktop, laptop, and workstations market.
That’s an increase from the 7.1% market share reported in Q1 2023.
Source: IDC
Number of Active Apple Devices Worldwide
According to the Q1 2024 press release, there are 2.2 billion active Apple devices worldwide.
Here’s a table with the number of active Apple devices worldwide since 2016:
Year
Active Apple Devices Worldwide
2016
1 billion
2020
1.5 billion
2022
1.8 billion
2023
2.2 billion
Apple Ad Revenue
Apple is forecasted to generate $10.34 billion in ad revenue worldwide in 2024.
In the US alone, Apple is estimated to bring in $6.17 billion in ad revenue in 2024. That’s a 20.98% increase compared to the previous year.
Here’s a detailed breakdown of Apple ad revenue worldwide since 2021:
Year
Apple Ad Revenue (US)
2021
$3.05 billion
2022
$4.32 billion
2023
$5.10 billion
2024
$6.17 billion
Apple Music Subscribers
Apple Music has 89.8 million subscribers worldwide as of September 2023. That’s an increase from 78 million subscribers in June 2021.
Here’s a detailed breakdown of Apple music subscriber growth since October 2015:
Date
Apple Music Subscribers
October 2015
6.5 million
January 2016
10 million
February 2016
11 million
March 2016
12 million
April 2016
13 million
May 2016
14 million
June 2016
15 million
August 2016
16 million
September 2016
17 million
December 2016
20 million
June 2017
27 million
September 2017
30 million
March 2018
38 million
April 2018
40 million
May 2018
50 million
November 2018
56 million
June 2019
60 million
December 2019
68 million
June 2020
72 million
June 2021
78 million
September 2023
89.8 million
Sources: Statista, MIDiA Research
Number of Available Apps in the Apple App Store
According to recent data, 3.84 million apps are available in the Apple App Store.
Here’s a table with the number of available apps in the Apple App Store since July 2008:
Date
Available Apps in the Apple App Store
July 2008
49,538
July 2009
71,707
July 2010
153,573
July 2011
281,298
July 2012
452,974
July 2013
715,364
July 2014
958,048
July 2015
1,404,576
July 2016
1,975,112
July 2017
2,338,835
July 2018
2,450,223
July 2019
3,062,241
July 2020
3,420,161
July 2021
3,596,054
July 2022
3,800,187
July 2023
3,835,661
Source: Statista
Number of Available Games in the Apple App Store
The Apple App Store currently offers 1.02 million games for download.
Here’s a table with the number of available games in the Apple App Store since July 2008:
Date
Available Games in the Apple App Store
July 2008
44,678
July 2009
50,410
July 2010
65,729
July 2011
89,499
July 2012
118,993
July 2013
162,548
July 2014
223,988
July 2015
396,094
July 2016
631,091
July 2017
783,269
July 2018
811,911
July 2019
903,489
July 2020
957,390
July 2021
984,198
July 2022
1,014,128
July 2023
1,021,172
Source: Statista
How Many People Work at Apple?
As of September 2023, Apple had around 161,000 employees worldwide.
The number of employees decreased from 164,000 in 2022.
Here’s a detailed breakdown of the number of Apple employees worldwide since 2009:
Year
Apple Employees
2009
36,800
2010
49,400
2011
63,300
2012
76,100
2013
84,400
2014
97,000
2015
110,000
2016
116,000
2017
123,000
2018
132,000
2019
137,000
2020
147,000
2021
154,000
2022
164,000
2023
161,000
Among Apple employees in the US on an H-1B visa, the median base salary is $164,299.
Source: Apple, H1B Salary Database
Conclusion
That’s it for my list of Apple stats in 2024.
Apple operates in a highly competitive environment with companies like Samsung and Xiaomi. It will be interesting to see whether Apple will be able to maintain its market dominance in the future.
The post Apple Statistics – Users, Devices, and Revenue appeared first on Backlinko.


